Monday, December 16, 2013

A crude JMS performance comparison between different WebLogic server persistence stores

When it comes to persisting service and subsystems data (i.e. JMS), WebLogic server offers customers a choice: filesystem or relational database using JDBC.  Persistence store has implications on WLS performance and systems management.  In this post, I will provide an unofficial JMS performance comparison using different persistence stores.

PLEASE NOTE: This is not an official Oracle performance benchmark.  It is just intended as an example to give readers an idea about possible performance differences when considering different persistent stores.

WebLogic persistence store provides a high-performance and transactional store for those WebLogic services and subsystems that need to store their data.  As an example, WebLogic JMS uses the persistence store for storing persistent messages and transmission of messages between Store-And-Forward (SAF) agents. 

The persistence store plays an important role in performance and high-availability of WebLogic applications and topology.  There are also considerations for management of  the persistence store.

In this blog, I will be sharing metrics from the following scenarios:
  1. WebLogic server JMS performance using default persistence store (filesystem)
  2. WebLogic server JMS performance using a  local DB persistence store
  3. WebLogic server JMS performance using a remote DB persistence store

In all cases, WLS version 12.1.2 was running in a Windows 7 (64-bit) environment on a Dell Pecision M6600 with i7-2920xm cpu @ 2.5 and  16G RAM.  I used the bundled, 64-bit Hotspot JVM with default heap: Xms256m Xmx512m.

In the second case, I used Oracle DB EE version 11.2.0.1 in the same Windows 7 environment as WLS.  Again, all default settings.

In the third scenario, I used a remote Oracle DB EE version 12.1.0 on a 64-bit machine running OEL v5 under OVM.  The average ping between the Windows and Linux servers was 45 ms.

For the testing, I used a standalone JMS client application to send WLS 1K, 4K, 16K, and 64K persistent messages.  In each run,  the client instantiated 4 concurrent threads to send 1000 messages to WLS (250 messages / thread).  The client ran local to the WLS server, and between each test, all the messages in the JMS queue was cleared.

Here is a summary of average message throughput for each scenario:


So, what is the key take-away from the stats above?  When using a local database, as the size of the message grows, you may see performance degradation of up 123.02% for a 64K message.   When you compare this with the remote database, it took more than 3600 times longer to commit 1000 64K messages to JMS persistence store backed by the remote DB...

So, what is the right persistence store strategy for you?  There are a lot of considerations.  Please take a look at  Using the WebLogic Persistence Store for considerations and limitations.  Also, as I said, I used vanilla, out-of-the-box parameters for this test.  You should consult Tuning the WebLogic persistence store for configuration and best practices.  

Monday, December 09, 2013

WebLogic Server 12c RESTful Management Services

WebLogic Server (WLS) 12c delivers over 200 new features and enhancements.  With 12c, Oracle extended the WebLogic Management Framework with a set of RESTful management services.  These services provide a light-weight and flexible interface for monitoring WebLogic Server.  In this post, I will describe how to use this interface.

In 12c, Oracle added REST interface for managing WLS resources.  In 12.1.2, this interface allows administrators to monitor WLS resources (servers, clusters, applications, datasources) in any environment where a basic HTTP library is available for communicating with WebLogic admin server, and a DOM or JSON library exists for handling request/response messages.

Please refer to Administering Oracle WebLogic Server with RESTful Management Services for an overview of this feature and how to enable it.  If you don’t have access to the WebLogic admin console, refer to doc 1565067.1 to enable this using WLST.

Interface Design

WLS RESTful Management Service was designed based on a common REST design pattern (singular and plural nouns).  In WLS RESTful interface, there are two types of resources: a singular resource (item) and a set of resources (collection).    

As an example, if you want to see the collection of servers running in WLS, you'd use the following resource url:  http://localhost:7001/management/tenant-monitoring/servers

If you want to get information about a specific server, you'd use the following:
http://localhost:7001/management/tenant-monitoring/servers/AppServer1


Similarly, you'd use the same URLs to reference other resources:
http://localhost:7001/management/tenant-monitoring/clusters
http://localhost:7001/management/tenant-monitoring/clusters/{cluster name}
http://localhost:7001/management/tenant-monitoring/applications
http://localhost:7001/management/tenant-monitoring/applications/{application name}
http://localhost:7001/management/tenant-monitoring/datasources
http://localhost:7001/management/tenant-monitoring/datasources/{datasource name}

As of WLS 12.1.2, you can only use HTTP GET to retrieve information about resources described above. Compared to WLST, this is currently very limited.  In future releases of WLS, the list of supported resources and types of operations by WLS REST Management Service MAY be expanded.  This is not a guarantee or statement of product direction.  If you are interested in this feature, please tune in to WLS product management blog for future announcements.

Media-Types & Usecases

WLS RESTful Management Service supports “representation” of resources in HTML, XML, and JSON.  The representation refers to the format of the response message sent from WebLogic back to client.  

In the request message, client uses the “Accept” HTTP header to tell WebLogic how to encode the response message.  In the response message, WebLogic indicates the format of the response in Content-Type response header:

HTML Encoded Response


JSON Encoded Response


XML Encoded Response


So, what is the right format to choose?   This is an important question which depends on your usecase and the programming environment.

At the most basic level, as an example, you may be in a situation where you need to provide WLS server status for "level-1" operations support team.   All you have to do is to embed an HTML fragment in a custom monitoring dashboard to show the status of WLS servers.  For this scenario, the HTML encoded response may meet the  requirements without any programming efforts.

At the next level, the requirements may be a little more sophisticated.  After you call the service, you may need to parse the response and show only the desired values, and in a specific format. In this case, you may choose the JSON format to be used in a Javascript environment.

Finally, the requirements may be more sophisticated in terms of parsing, data validation, programming environment... and the usecase/application may even involve receiving data from other enterprise IT resources with limitations on data formats...  In this case, it may make sense to standardize on XML.


Sample Code

As I was getting ready to share some sample code in Python and Java to get you started, I found the following blog post http://www.oracle.com/technetwork/articles/soa/oliveira-wls-rest-javafx-1723982.html. It provides an excellent programming reference with sample code. 

Conclusion

With customers developing, testing, and managing applications and servers on-premise and in the cloud, WLS REST Management Service provides a uniform way for developing custom management solutions wherever the resources are running.   The interface is easy to understand and use, and it doesn't require any WLS runtime jar files to run...   


If you are interested to learn more about the new features in WLS 12c, take a look at this recent whitepaper by WLS product management. 

Tuesday, December 03, 2013

Oracle Java Cloud Service SDK

Oracle Java Cloud Service (JCS) is a Platform-as-a-Service built on top of WebLogic Server and other Fusion Middleware solutions (i.e. Identity Management). The platform is powered by ExaLogic and ExaData for elasticity, performance, and high availability.

You can build and deploy different kinds of enterprise java apps (i.e. servlets, web services) on JCS as long as you comply with its API restrictions. Since the foundation of Java Cloud Service is WebLogic, you can build and test your application locally in Eclipse (WLS 12.1.2 and above) and when ready deploy to JCS. JCS is part of a broader portfolio of Oracle’s Cloud offerings.

JCS offers a UI for application lifecycle management and monitoring. These capabilities are also available from Oracle Java Cloud SDK.   After you download the SDK, take a look at its directory structure and content:


The samples directory contains a set of applications (based on JEE 6 tutorial) with instructions on how to build and deploy them on Oracle JCS.  Take a look at readme.txt and ee-samples.readme.txt to get started.

Next, take a look at the doc directory to see how to use the SDK to build, deploy, and manage the applications locally and also on JCS.

The lib directory contains the SDK jar utilities to support application development and management tasks.
These include ANT tasks and Maven plugins to facilitate development automation.  The SDK also provides a command-line interface to perform application development, lifecycle management, and monitoring.
It is important to note that these tools can also be run against a local WebLogic server to support typical cloud development and deployment scenarios.
Take a look at index.html in the doc directory to learn more about the tools and their usage.

After the installation of the SDK, you can invoke the command-line interface using  java –jar javacloud.jar without specifying any parameters. This will print a list of available commands:


You can use java –jar javacloud.jar usage to print a help page about the tool:


Have a look at the page. It provides more details about the available commands, usage and parameters.
As an example, you can monitor the status of your jobs on the platform as follows:


-u specifies the userid when you registered with the service
-p specifies the password when you registered with the service
-identitydomain specifies the identity domain when the service was provisioned
-datacenter is the datacenter where your service was provisioned (i.e. us1, us2, em1, em2, ap1, ap2)

When you sign up for Oracle Java Cloud service and activate the service, you will receive a welcome email containing the information above.

The parameters above can be stored in a javacloud.properties under the user's home directory.  The only exception is password.  When you run the commands, the SDK will prompt you to enter a password:


Administrators can use the various commands to install/start/stop/delete or monitor the status of applications.

For developers, the SDK can be configured in Eclipse (OEPE), for application management and monitoring as follows.

Start by creating a new Oracle Cloud server:

JDeveloper and NetBeans are also supported.  Refer to Oracle Java Cloud Service welcome email to specify the parameters.   

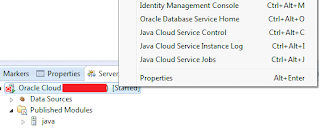
If you specify the correct configuration parameters, you should be able to see your JCS environment under the server's tab as follows:


After the JCS environment is configured, you can publish your applications to JCS, manage them, and monitor statistics.


Oracle is making a lot of investments in cloud research and development.  With WebLogic as the foundation of Java Cloud Service, and the common tooling that supports both on-premise WebLogic as well as JCS, customers can use their preferred IDE (OEPE, JDeveloper, NetBeans) to develop and test locally and deploy to JCS without any code changes - or - use JCS to do all the development and testing, and deploy to production servers on-premise. This brings cost and time efficiencies to development and testing.  There are additional customer benefits, as JCS abstracts the underlying WebLogic and FMW stack taking the ownership and responsibility for installation, configuration, operations, patch management, performance, SLA, ... away from customers.  

For more information about Java Cloud Service, visit Java Cloud Service documentation.